
Vermont Joins Utah and Other States in Skyrocketing US Tourism With a Surge in Tourist Arrivals During the Third Quarter of 2026
Vermont has joined Utah and other states in driving a powerful rise in US tourism as tourist arrivals surged during the third

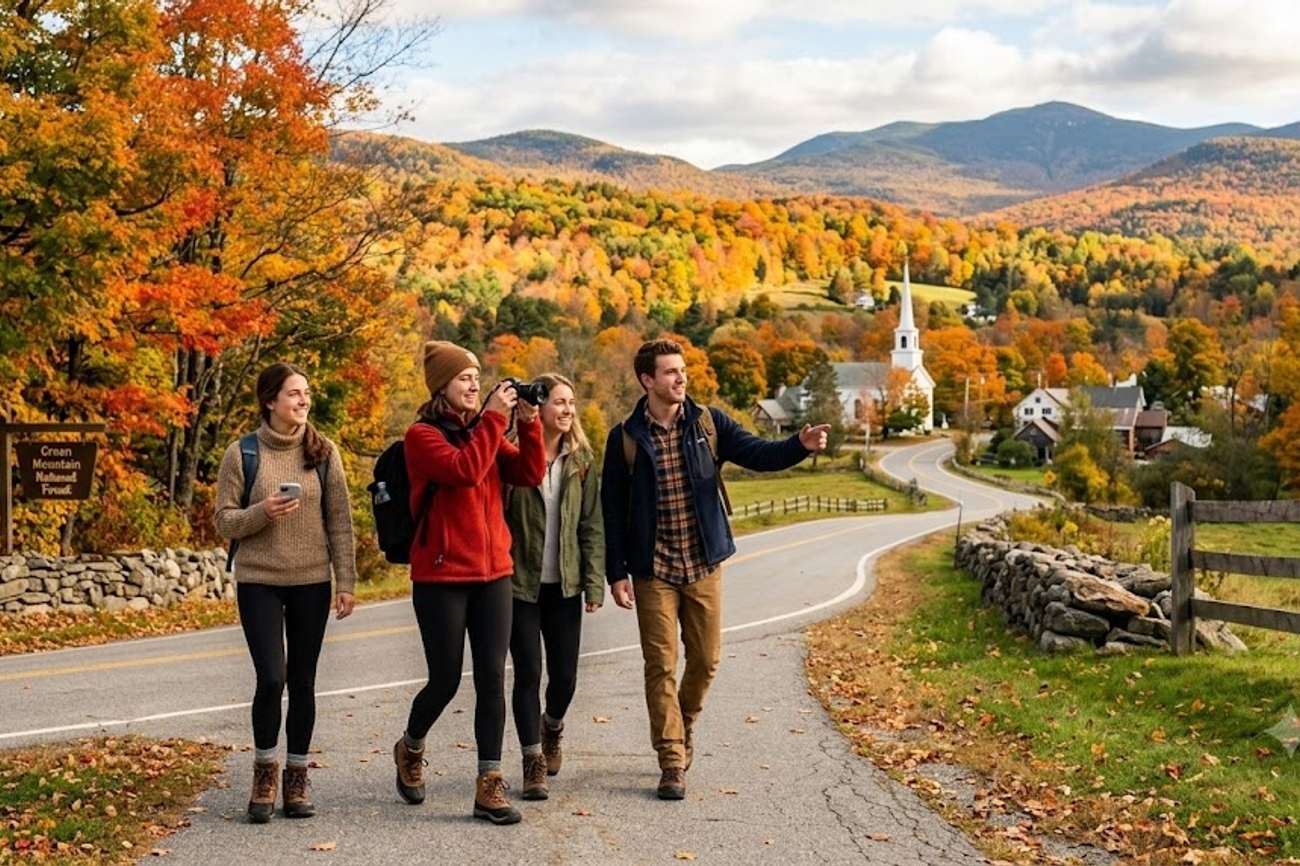
Image generated by AI
Vermont has joined Utah and other states in driving a powerful rise in US tourism as tourist arrivals surged during the third quarter of 2026, supported by strong summer demand, outdoor experiences and renewed traveller interest. While Vermont recorded the most significant large-scale summer acceleration among the compared destinations, Utah continued its steady growth and other states also contributed to the wider tourism momentum. The surge in arrivals reflects how diverse attractions, seasonal travel appeal and improving visitor demand helped Vermont and other US states strengthen their tourism performance during the available third-quarter period.
Tourism momentum strengthened across Utah, Vermont, Wisconsin and South Carolina during the available third-quarter period of July and August 2026. The pattern, however, is not uniform. Vermont produced the largest arrival volume and a strong summer acceleration, while Utah recorded steadier single-digit gains. Wisconsin and South Carolina posted much larger percentage increases, but from considerably smaller arrival bases. The figures also show that the Q3 improvement followed very different first-half trajectories in each state.
September 2026 is not included in the supplied dataset. The Q3 figures below therefore cover July–August only, while the full tables show January–August trends.
Utah — Summer Growth Turns a Mixed First Half Into Steady Gains
Utah entered Q3 with an uneven first half but strengthened during summer. Arrivals reached 61.1K in July, up 3.2%, before August added 56.6K, up 3.1%. Combined July–August arrivals reached 117.7K, approximately 3.2% above 2025. The wider trend is notable because Utah moved between gains and declines earlier in the year, including +18.9% in January but -4.1% in March. By summer, however, growth had become more consistent. Utah’s outdoor recreation, national parks, road-trip appeal and mountain destinations provide a broad tourism base capable of supporting demand across several seasons.
Utah Tourism Arrival Trend — January to August 2026 Month 2026 2025 YoY Change Trend January 60.9K 51.2K +18.9% Strong growth February 45.3K 45.7K -0.9% Slight decline March 53.7K 56.0K -4.1% Decline April 55.6K 53.8K +3.3% Recovery May 51.3K 51.5K -0.4% Broadly flat June 59.7K 57.1K +4.6% Growth July 61.1K 59.2K +3.2% Q3 growth August 56.6K 54.9K +3.1% Q3 growth Jan–Aug Total 444.2K 429.4K +3.4% Positive overall Q3 available: Jul–Aug 117.7K 114.1K +3.2% Steady growth
Utah’s trend is one of stabilisation rather than a sudden surge. After fluctuating during the first five months, the state recorded three consecutive positive months from June through August.
Vermont has seen a significant increase in tourist arrivals during the third quarter of 2026, joining states like Utah in experiencing a surge in US tourism. According to official reports, this growth can be attributed to the state's natural beauty and outdoor recreational opportunities, with visitors flocking to experience the fall foliage. For more information on travel requirements and guidelines, visitors can check the official US Customs and Border Protection website for the latest updates.
Vermont — Summer Tourism Accelerates After a Weak Start to 2026
Vermont shows the clearest turnaround. Arrivals were down 10.8% in January, 3.0% in February and 3.6% in March. April changed the direction, and growth accelerated through summer. July arrivals jumped to 281K, up 20.1%, while August reached 276K, another 9.1% increase. That pushed July–August arrivals to 557K, compared with 487K a year earlier, a gain of approximately 14.4%. Vermont’s mountains, lakes, outdoor recreation, small towns, cultural attractions and summer events give the state a diverse seasonal tourism product, helping demand recover strongly after its weaker opening quarter.
Vermont Tourism Arrival Trend — January to August 2026 Month 2026 2025 YoY Change Trend January 132K 148K -10.8% Sharp decline February 129K 133K -3.0% Decline March 135K 140K -3.6% Decline April 140K 126K +11.1% Strong reversal May 162K 137K +18.2% Acceleration June 186K 174K +6.9% Continued growth July 281K 234K +20.1% Major Q3 surge August 276K 253K +9.1% Strong Q3 growth Jan–Aug Total 1.441M 1.345M +7.1% Strong overall growth Q3 available: Jul–Aug 557K 487K +14.4% Accelerating
Vermont moved from three consecutive declines at the beginning of 2026 to five consecutive months of growth from April through August. July was the standout month, adding approximately 47K arrivals year on year.
Wisconsin — Q3 Growth Accelerates Dramatically From a Small Base
Wisconsin presents the most volatile trend. January fell 6.9%, February rose 11.5%, March declined 12.0%, and April was flat. From May onwards, however, the supplied arrival series strengthened sharply. July increased from 609 to roughly 1.1K, while August climbed from 622 to 783. That places July–August growth at approximately 53.0%, although from a relatively small base. The dramatic percentage increase therefore needs to be considered alongside the full January–August performance, which was only about 1.2% higher than 2025. Summer outdoor recreation, events, lake tourism and road trips can help explain the stronger seasonal performance.
The surge in tourism has also led to an increase in passenger traffic at major airports, including the Burlington International Airport, which has seen a significant rise in flight bookings. Travelers can visit the TSA website for information on security protocols and to plan their trips accordingly, ensuring a smooth and hassle-free travel experience. Additionally, airlines such as Delta and American Airlines have increased their flight frequencies to accommodate the growing demand.
Wisconsin Tourism Arrival Trend — January to August 2026 Month 2026 2025 YoY Change Trend January 5.4K 5.8K -6.9% Decline February 9.7K 8.7K +11.5% Strong recovery March 10.3K 11.7K -12.0% Sharp decline April 2.8K 2.8K 0.0% Flat May 729 313 +132.9% Major percentage surge June 510 417 +22.3% Strong growth July ~1.1K 609 ~+80.6% Q3 surge August 783 622 +25.9% Q3 growth Jan–Aug Total ~31,322 ~30,961 ~+1.2% Modest overall growth Q3 available: Jul–Aug ~1,883 1,231 ~+53.0% Rapid acceleration
Wisconsin’s headline Q3 percentage is impressive, but the underlying scale remains small. July–August growth of approximately 53.0% contrasts sharply with January–August growth of only about 1.2%, showing how strongly the summer months changed the trajectory.
South Carolina — Summer Arrivals Accelerate as August More Than Doubles
South Carolina recorded the strongest overall January–August percentage growth among the four states in the supplied series. Arrivals increased in almost every month, with June the only decline. July reached 1.8K, up 20.0%, before August climbed to around 1.5K from just 677, an approximate increase of 121.6%. The available Q3 total consequently reached around 3.3K, up roughly 51.6%. Beaches, golf, Charleston, Myrtle Beach, cultural attractions and warm-weather leisure demand give South Carolina a broad tourism proposition. Its performance is particularly notable because the growth is not confined to Q3; seven of the eight months shown exceeded 2025.
South Carolina Tourism Arrival Trend — January to August 2026 Month 2026 2025 YoY Change Trend January 1.5K 1.1K +36.4% Strong growth February 1.3K 1.1K +18.2% Growth March 1.8K 1.4K +28.6% Strong growth April 2.5K 1.9K +31.6% Strong growth May 1.7K 1.0K +70.0% Surge June 1.5K 1.7K -11.8% Temporary decline July 1.8K 1.5K +20.0% Q3 rebound August 1.5K 677 ~+121.6% Q3 surge Jan–Aug Total ~13.6K ~10.38K ~+31.1% Rapid overall growth Q3 available: Jul–Aug ~3.3K ~2.18K ~+51.6% Strong acceleration
South Carolina has the most consistently positive trajectory. Seven of the eight months shown are ahead of 2025. June interrupted the expansion, but July immediately returned to growth and August more than doubled from the previous year’s rounded figure.
Tourism officials are optimistic about the continued growth of the industry, citing the state's unique attractions and experiences as major draws for visitors. For insights into the state's tourism industry and to plan a trip, visitors can explore the Vermont Tourism website, which offers a wealth of information on accommodations, activities, and events. By understanding the trends and patterns in tourist arrivals, officials can better develop strategies to support the local economy and enhance the overall visitor experience.
Full Q3 Available Tourism Comparison State July 2026 August 2026 Jul–Aug 2026 Jul–Aug 2025 Q3 Available YoY Jan–Aug YoY Overall Trend Utah 61.1K 56.6K 117.7K 114.1K +3.2% +3.4% Steady expansion Vermont 281K 276K 557K 487K +14.4% +7.1% Accelerating Wisconsin ~1.1K 783 ~1.88K 1.23K ~+53.0% ~+1.2% Sharp Q3 rebound from small base South Carolina 1.8K 1.5K ~3.3K ~2.18K ~+51.6% ~+31.1% Strong sustained growth January–August Trend Comparison State Jan–Aug 2026 Jan–Aug 2025 Approx. Gain YoY Change Positive Months Negative Months Utah 444.2K 429.4K +14.8K +3.4% 5 3 Vermont 1.441M 1.345M +96K +7.1% 5 3 Wisconsin ~31.32K ~30.96K ~+361 ~+1.2% 5 2 + 1 flat South Carolina ~13.6K ~10.38K ~+3.22K ~+31.1% 7 1 What the Tourism Trends Show
The strongest volume story is Vermont, which added roughly 96,000 arrivals across January–Au
FAQ: Vermont Joins Utah and Other States in S 2026
What's driving Vermont's tourism surge? Increased outdoor activities and fall foliage.
Are bookings still available for 2026? Yes, but popular destinations are filling up quickly.
What are the top attractions in Vermont? Ski resorts, national parks, and local craft breweries.
How can I plan my trip to Vermont? Visit the official Vermont tourism website for guides and itineraries.
Related Travel Guides
- Ontario Rises With Quebec and All Other Destinations in Pushing Canadian Tourism Revenue Beyond C$140 Billion as Provinces Ride a Powerful Travel Economy in 2026
- Tourism Australia Seeks AI Data Partner to Sharpen Insight Into Global Marketing Spend
- Kenya Aligns with Tanzania and More African Nations as Germany Issues New Travel Advisory Covering Safety Alerts and Entry Rules
Disclaimer
This article is for informational and educational purposes only. It does not constitute legal, financial, or professional advice. While we strive to provide accurate and up-to-date information, travel policies, regulations, and conditions change rapidly. Always verify information with official sources before making travel decisions. Nomad Lawyer makes no representations about the accuracy, reliability, completeness, or suitability of the information provided. Readers should consult qualified professionals for advice specific to their circumstances. The views expressed in this article are those of the author and do not necessarily reflect the views of Nomad Lawyer.
Kunal K Choudhary
Co-Founder & Contributor
A passionate traveller and tech enthusiast. Kunal contributes to the vision and growth of Nomad Lawyer, bringing fresh perspectives and driving the community forward.
Learn more about our team →