
US Flight Gridlock: 2,328 Delays and 105 Cancellations Hit Major Hubs From San Diego to Seattle and Orlando

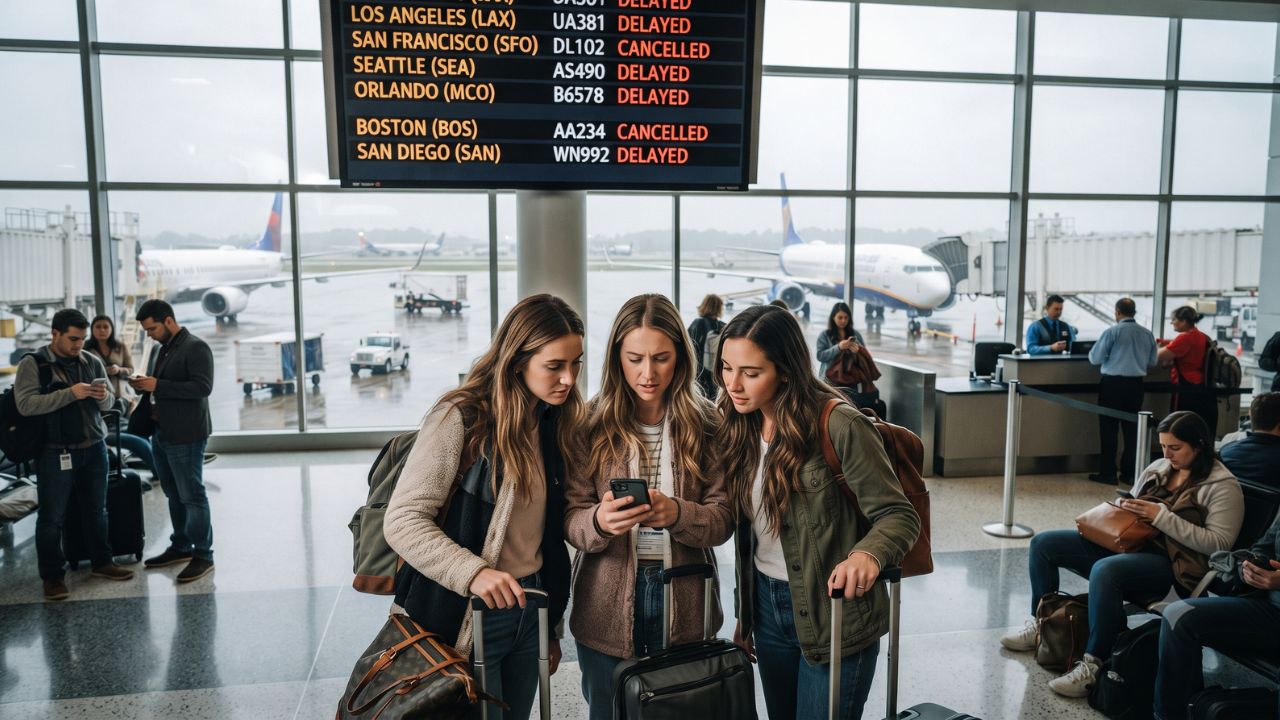
While major legacy airlines absorbed hundreds of cascading flight delays, regional operator Tradewind Aviation suffered a sharp 19% schedule cancellation rate with 33 grounded flights and zero reported delays. Across the United States, a confluence of heavy coastal crosswinds, convective thunderstorm cells, and critical runway maintenance produced 2,328 flight delays and 105 cancellations nationwide.
Official flight tracking intelligence recorded by FlightAware as of October 3, 2026, at 3:30 pm ET highlights operational strain across major domestic transport corridors. Air traffic controllers at the Federal Aviation Administration System Command Center instituted ground delay programs and metering restrictions to manage constrained airspace from the Pacific Northwest down to southern Florida.
Weather and Infrastructure Bottlenecks Behind National Disruptions
The nationwide disruption stems from three primary operational bottlenecks across key regional aviation centers:
1. Severe Weather and Wind Conditions
Pacific coastal wind gusts at San Diego International Airport (SAN) forced air traffic controllers to implement ground delay programs averaging 49 minutes, resulting in 183 delayed flights and 3 cancellations. In Florida, heavy afternoon thunderstorms monitored by the Greater Orlando Aviation Authority caused departure ground stops at Orlando International Airport (MCO) averaging 30 minutes, leading to 109 delays and 3 cancellations. In the Pacific Northwest, low cloud ceilings at Boeing Field/King County International Airport (BFI) created departure delays averaging 15 minutes.
2. Airport Runway Maintenance
At Seattle-Tacoma International Airport (SEA), ongoing airfield runway construction restricted arrival and departure capacity. The resulting infrastructure bottleneck triggered 147 flight delays averaging 30 minutes alongside 11 cancellations.
3. Air Traffic Volume and Taxiway Gate-Holds
High-density hub congestion produced gate-hold and taxi delays of 15 minutes or less at Boston Logan International Airport (BOS) and Chicago O'Hare International Airport (ORD). O'Hare recorded a 5% departure delay rate and a 6% arrival delay rate, while Boston Logan logged 85 delays and 9 cancellations.
Airport Disruption Statistics Across the United States
The operational impact varied significantly between major international connecting hubs and regional commercial airports:
| Airport Facility | IATA Code | Flight Delays | Flight Cancellations | Dominant Operational Factor |
|---|---|---|---|---|
| San Diego International Airport | SAN | 183 | 3 | High crosswind ground delays (avg. 49 min) |
| Seattle-Tacoma International Airport | SEA | 147 | 11 | Airfield runway construction constraints |
| Orlando International Airport | MCO | 109 | 3 | Convective thunderstorm ground stops |
| Los Angeles International Airport | LAX | 93 | 4 | West Coast airspace pacing and gate holds |
| Boston Logan International Airport | BOS | 85 | 9 | Northeast corridor taxi and gate congestion |
| Newark Liberty International Airport | EWR | 71 | 6 | New York metro airspace metering |
| San Francisco International Airport | SFO | 68 | 3 | Coastal fog and arrival slot management |
| Anchorage International Airport | ANC | 28 | 5 | Sub-arctic weather and cargo rotation delays |
| Luis Muñoz Marín International Airport | SJU | 24 | 11 | Caribbean corridor weather and feeder holds |
| Westchester County Airport | HPN | 7 | 10 | Regional executive and commercial slot holds |
| Nantucket Memorial Airport | ACK | 2 | 20 | Island fog and low ceiling cancellations |
| Teterboro Airport | TEB | 0 | 14 | Corporate jet ground stops and weather holds |
Airline Schedule Performance Breakdown
Major domestic and regional carriers experienced varying degrees of disruption depending on their fleet concentration at affected hubs:
- American Airlines: Absorbed the largest overall delay volume in the country, logging 388 flight delays representing a 12% schedule disruption rate across its national network.
- Southwest Airlines: Recorded 371 delayed flights, reflecting a 10% network delay rate driven by rolling setbacks at West Coast and Florida stations.
- United Airlines: Logged 221 flight delays and 17 cancellations, amounting to a 7% disruption rate across its Chicago, Newark, and West Coast hubs.
- Delta Air Lines: Registered 217 delayed flights and 10 cancellations, also reflecting a 7% delay rate across its domestic operation.
- Tradewind Aviation: Faced an acute 19% cancellation rate, grounding 33 flights with zero reported delays, primarily due to island weather restrictions across Northeast coastal routes.
Practical Steps for Air Passengers
Travelers navigating US airports during periods of weather and operational delays should follow established travel safeguards:
- Monitor Live Flight Status: Check your carrier's mobile application before traveling to the terminal. Airlines update gate assignments and estimated departure times faster digitally than airport flight information display monitors.
- Track Connecting Segments Individually: For itineraries involving connections in Chicago, Seattle, or Boston, verify that the inbound aircraft for your connecting flight is operating on time.
- Prepare Carry-On Essentials: Pack essential prescription medications, infant care items, and portable charging banks in your personal carry-on bag in case checked luggage is delayed during aircraft transfers.
- Know Your Rebooking Options: If your flight is cancelled due to airline maintenance or scheduling issues, carriers are obligated to offer complimentary rebooking on the next available flight or provide a full refund to the original form of payment.
FAQ: US Flight Cancellations and Delays October 2026
What caused the flight delays across US airports today? Flight delays were driven by high crosswinds in San Diego, thunderstorms in Orlando, runway construction in Seattle, and gate congestion in Chicago and Boston.
Which US airline experienced the highest number of delays? American Airlines recorded the highest volume with 388 delayed flights (a 12% delay rate), followed closely by Southwest Airlines with 371 delays (a 10% delay rate).
Why did Tradewind Aviation cancel 19% of its flights? Tradewind operates specialized regional routes to coastal and island destinations like Nantucket, where localized low ceilings and fog forced outright cancellations rather than extended delays.
How do I check if my airport has an active FAA ground stop? Passengers can check the FAA's official National Airspace System status page (nasstatus.faa.gov) in real time to view active ground stops, ground delay programs, and average wait times.
Travelers who track airfield conditions and stay proactive with mobile airline alerts can turn unexpected flight delays into manageable travel adjustments.
Related Travel Guides
Disclaimer
This article is for informational and educational purposes only. It does not constitute legal, financial, or professional advice. While we strive to provide accurate and up-to-date information, travel policies, regulations, and conditions change rapidly. Always verify information with official sources before making travel decisions. Nomad Lawyer makes no representations about the accuracy, reliability, completeness, or suitability of the information provided. Readers should consult qualified professionals for advice specific to their circumstances. The views expressed in this article are those of the author and do not necessarily reflect the views of Nomad Lawyer.
Raushan Kumar
Founder & Lead Developer
Full-stack developer with 11+ years of experience and a passionate traveller. Raushan built Nomad Lawyer from the ground up with a vision to create the best travel and law experience on the web.
Learn more about our team →