
Flights Cancelled Swept The United States As New York, Atlanta, And More Face 192 Cancellations And 2,094 Delays, Disrupting Travel
Flights Cancelled Swept The United States As New York, Atlanta, And More Face 192 Cancellations And 2,094 Delays, Disrupting Travel

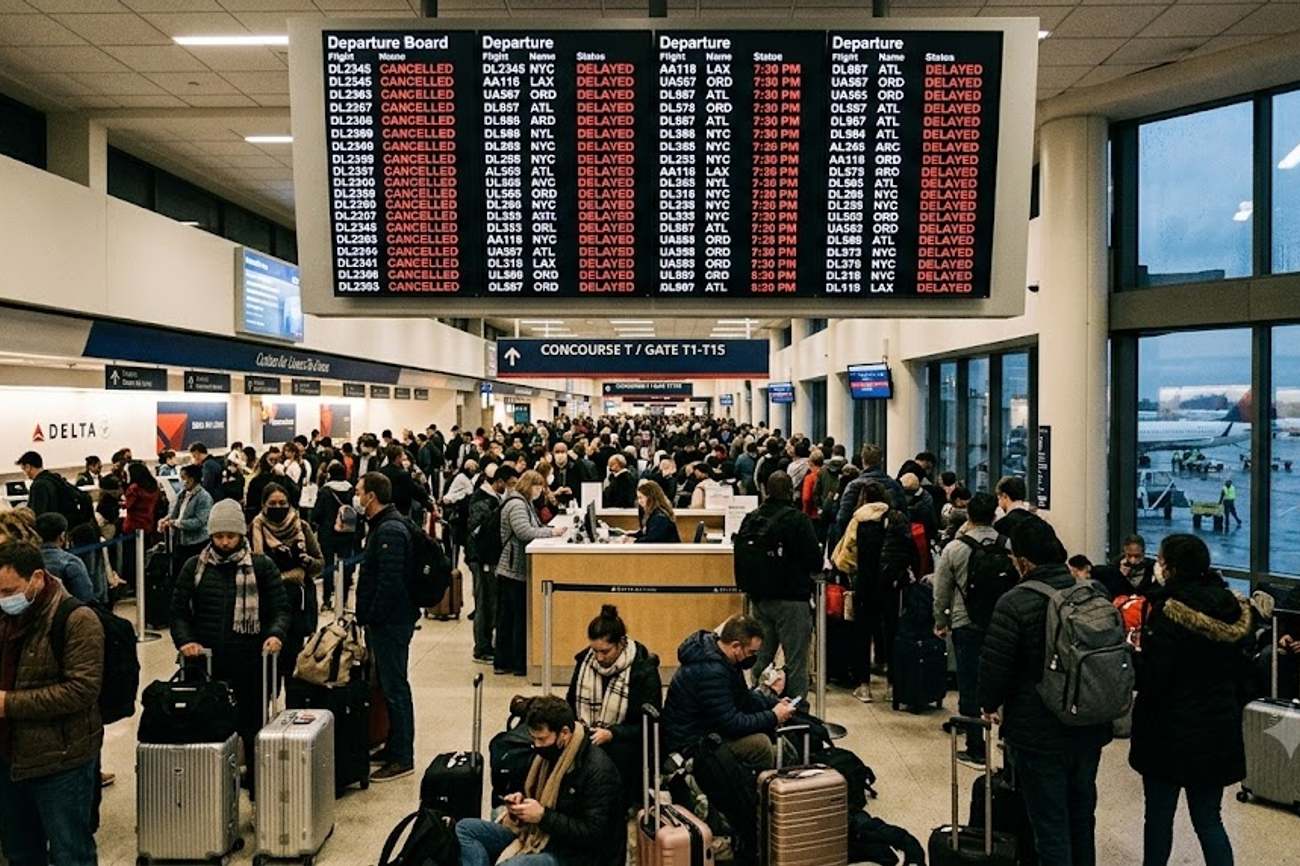
Image generated by AI
Domestic flight disruptions have plummeted from over 6,000 delays and 1,000 cancellations yesterday to 2,094 delays and 192 cancellations today—a 65% reduction in total delay volume within 24 hours. This sharp decline signals a transition from a systemic infrastructure failure to localized operational friction, though the volatility underscores the fragility of the current US aviation network.
The Infrastructure Fragility Index — Current Data Points
The current operational snapshot reveals a fragmented disruption pattern across the US aviation network. While the systemic collapse seen yesterday—triggered by a failed telecommunications circuit and a severed backup fiber cable—has subsided, the residual impact is evident in the 2,094 delays and 192 cancellations recorded today.
The data indicates that Atlanta Hartsfield-Jackson remains the primary pressure point in the network, recording 427 delays and 7 cancellations. The disparity between departure and arrival performance at this hub is striking: departing flights are experiencing a 22% delay rate, while destination flights sit at 16%. This 6-percentage-point gap suggests that outbound recovery is lagging behind inbound flow, a common pattern when hubs struggle to reset after a systemic shock.
Carrier-specific data shows a heavy concentration of disruptions within the legacy network. Delta Air Lines leads the disruption count with 418 delays and 4 cancellations. American Airlines follows with 266 delays and 26 cancellations. United reports 169 delays and 49 cancellations, while PSA Airlines shows a high cancellation-to-delay ratio with 54 cancellations against 83 delays.
Regional Disruption Benchmarks — Systemic vs. Localized
The shift from yesterday's data to today's represents a move from "Systemic Failure" (where the FAA halted traffic across the East Coast) to "Localized Operational Constraints." Today's disruptions are driven by a mix of residual backlog and specific environmental or infrastructure hurdles.
For instance, Boston Logan is currently managing a ground delay averaging 81 minutes due to runway construction. In contrast, San Francisco is managing a 40-minute ground delay caused by low ceilings. This demonstrates a dual-threat environment where planned infrastructure maintenance and unplanned weather events are compounding the recovery from yesterday's telecommunications failure.
The following table analyzes the current operational health of key US hubs based on today's reported figures:
| Airport | Delays | Cancellations | Key Metric | Primary Cause |
|---|---|---|---|---|
| Atlanta Hartsfield-Jackson | 427 | 7 | 22% Departure Delay | Residual Hub Congestion |
| Dallas-Fort Worth | 164 | 27 | 2% Cancellation Rate | Operational Recovery |
| Newark Liberty | 107 | 61 | 6% Destination Cancel | Systemic Aftermath |
| Boston Logan | 129 | 2 | 81-Min Avg Delay | Runway Construction |
| San Francisco | 121 | 1 | 40-Min Avg Delay | Low Ceilings (Weather) |
| Charlotte/Douglas | 102 | 11 | 7% Destination Delay | Operational Recovery |
| John F Kennedy | 86 | 8 | 9% Destination Delay | Systemic Aftermath |
| Denver | 81 | 3 | 5% Origin/Dest Delay | Operational Recovery |
When comparing these figures to broader industry benchmarks provided by IATA, it becomes clear that Newark Liberty is experiencing an anomalous cancellation spike. With 61 cancellations—the highest of any airport listed—Newark's 6% destination cancellation rate suggests that the East Coast telecommunications failure had a deeper, more lasting impact on the New York-area gateways than on Western hubs like Denver, which maintains a balanced 5% delay rate for both origin and destination flights.
Practical Traveler Advisory and Strategic Insights
The data indicates that we are currently in a "Recovery Window." While the massive cancellations of yesterday have ceased, the "ripple effect" is manifesting as high delay rates at major hubs.
If you are traveling through Atlanta Hartsfield-Jackson, the 22% departure delay rate means there is nearly a 1-in-4 chance your flight will be delayed. Travelers should allow an additional 2-3 hours for connections through this hub to avoid missed flights.
The recent wave of flight cancellations and delays across the United States, including major hubs like New York and Atlanta, has significantly disrupted travel plans for thousands of passengers. For the most up-to-date information on flight schedules and travel advisories, passengers can visit the Federal Aviation Administration website for official guidance. This resource provides critical information to help travelers navigate the challenges posed by these disruptions.
For those utilizing Newark Liberty, the high cancellation volume (61 flights) suggests that airlines are still scrubbing schedules to regain operational stability. Passengers should not rely on the airport display boards alone; instead, use real-time tracking via OAG or airline apps to confirm flight status at least 6 hours before departure.
Actionable booking and travel advice based on today's metrics:
- Hub Avoidance: If booking flexible travel for the next 48 hours, avoid connections through Newark Liberty and Atlanta, as these show the highest instability.
- Buffer Zones: For flights into Boston Logan, the 81-minute average ground delay makes tight connections (under 2 hours) high-risk.
- Carrier Selection: PSA Airlines currently shows the highest volatility in terms of cancellations relative to their total flight volume today. Travelers on PSA-operated regional legs should have a backup plan.
Network Stability Projections
The trajectory from 6,000+ delays yesterday to roughly 2,100 today suggests a rapid return to baseline operations. However, the presence of runway construction in Boston and weather restrictions in San Francisco indicates that the network will not reach 100% efficiency this week.
Historically, when a telecommunications failure occurs at the FAA level, the "tail" of the disruption lasts approximately 72 hours as crews and aircraft are repositioned. We can expect delay rates at East Coast hubs (JFK, EWR, BOS) to remain 5-10% above seasonal norms until the end of the current operational cycle.
The data suggests a shift toward "Precision Disruptions." Rather than the blanket halts seen yesterday, we are seeing targeted delays. The industry is moving toward a model where infrastructure upgrades (like Boston's runway work) are now coinciding with a fragile digital backbone, increasing the likelihood of "compounded delays."
FAQ: US Flight Disruptions 2024
Will flight prices increase due to these cancellations? Short-term volatility usually does not impact base fares, but "last-minute" rebooking seats on alternative carriers may carry a premium. Use price-tracking tools to monitor if these disruptions trigger a temporary spike in regional demand.
Is it a good time to book flights through New York airports? Wait 48 to 72 hours. Newark Liberty is currently showing a disproportionately high cancellation rate (61 today). Once the residual effects of the fiber cable failure clear, stability should return to normal levels.
Which airlines are expanding or recovering fastest? Delta Air Lines is managing the highest volume of delays (418), but their cancellation rate remains low (4), suggesting a strategy of "delay and deliver" rather than "cancel and reschedule."
How can I protect myself from these "systemic" failures? Book flights with longer layovers (3+ hours) at major hubs like Atlanta or Newark. When a telecommunications failure occurs, the first flights to be cancelled are usually those with the tightest connection windows.
The transition from systemic collapse to localized friction proves that the US aviation network is resilient, but its reliance on a few critical fiber cables remains a primary vulnerability.
Related Travel Guides
Disclaimer
This article is for informational and educational purposes only. It does not constitute legal, financial, or professional advice. While we strive to provide accurate and up-to-date information, travel policies, regulations, and conditions change rapidly. Always verify information with official sources before making travel decisions. Nomad Lawyer makes no representations about the accuracy, reliability, completeness, or suitability of the information provided. Readers should consult qualified professionals for advice specific to their circumstances. The views expressed in this article are those of the author and do not necessarily reflect the views of Nomad Lawyer.
Preeti Gunjan
Contributor & Community Manager
A passionate traveller and community builder. Preeti helps grow the Nomad Lawyer community, fostering engagement and bringing the reader experience to life.
Learn more about our team →