
US Airline Reliability Rankings Highlight Delay and Cancellation Rates
A US Department of Transportation analysis reveals JetBlue and Frontier recorded the highest flight disruption rates, while Delta led in reliability.
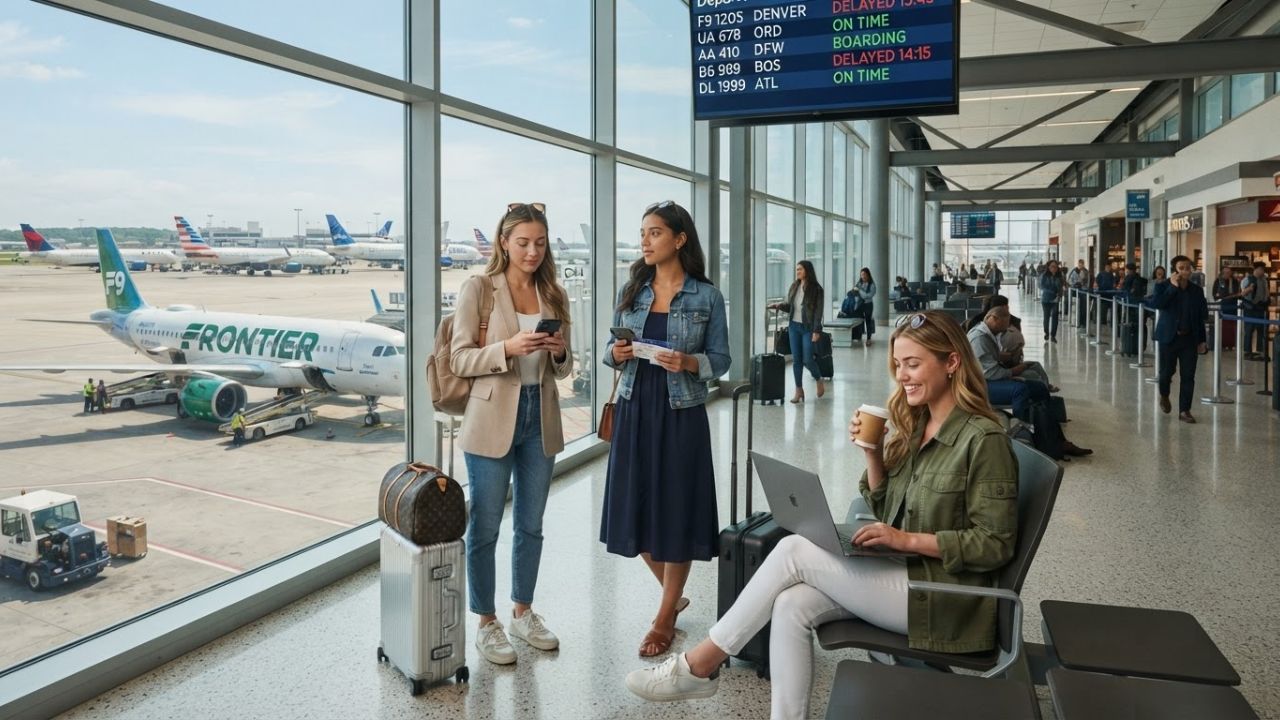
Image generated by AI
A US Department of Transportation flight records analysis reveals JetBlue and Frontier recorded the highest disruption rates in the country, while Delta led in reliability.
Flight disruptions continue to impact passenger travel plans across the United States. According to an analysis of approximately 7 million domestic flight records compiled by the US Department of Transportation (DOT) for the 12-month period ending May 2026, JetBlue Airways and Frontier Airlines recorded some of the highest disruption rates among the 14 major carriers examined.
JetBlue ranked as the lowest-performing carrier with a 29.29% overall disruption rate (delays and cancellations combined), while Frontier recorded a 28.88% disruption rate, placing it fourth. The analysis highlights the reliability differences between low-cost and full-service carriers across the domestic network.
US Airline Delay and Cancellation Metrics
Aviation performance rankings are evaluated based on punctuality (arriving within 15 minutes of schedule) and completed schedules. The following table provides the combined disruption rates, delays, cancellations, and strategic focus for the 10 leading US carriers from June 2025 to May 2026.
| Airline / Operating Carrier | Combined Disruption Rate | Flight Delay Rate (15m+) | Flight Cancellation Rate | Reliability Ranking / Performance | Primary Fleet & Market Focus |
|---|---|---|---|---|---|
| JetBlue Airways | 29.29% | 26.79% | 2.50% | 14th (Worst Overall) | Airbus A320/A321, East Coast/Caribbean |
| PSA Airlines | 29.26% | 24.92% | 4.34% | 13th (Highest Cancellations) | CRJ-700/900, American Eagle regional |
| Spirit Airlines | 29.11% | 25.70% | 3.41% | 12th (Ceased ops May 2026) | Airbus A320neo, Ultra Low-Cost |
| Frontier Airlines | 28.88% | 27.53% | 1.93% | 11th (High Delay/Low Cancel) | Airbus A320/A321neo, Ultra Low-Cost |
| American Airlines | 27.42% | 25.14% | 2.28% | 10th | Boeing 737 / Airbus A320, Global Network |
| Republic Airways | ~27.00% | ~22.85% | 4.15% | 9th (High Cancellations) | Embraer 170/175, Regional codeshare |
| Southwest Airlines | 23.56% | ~22.00% | ~1.56% | 4th | Boeing 737, Point-to-point domestic |
| Alaska Airlines | 22.77% | ~21.27% | ~1.50% | 3rd | Boeing 737 / Embraer 175, West Coast |
| United Airlines | 21.82% | ~20.32% | ~1.50% | 2nd | Boeing 737/777 / Airbus A320, Global |
| Delta Air Lines | 20.42% | 19.12% | ~1.30% | 1st (Best Performing) | Boeing 737/757 / Airbus A320, Global |
Performance rankings and cancellation stats compiled in coordination with the US Department of Transportation (DOT) Bureau of Transportation Statistics (BTS) and flight log registries.
Traveler Logistics and US Domestic Flight Connection Guide
From a ground-level perspective, the best way to navigate this is to book the first flight of the day, as aircraft and crew are typically already positioned at the gate, reducing the compounding delays that impact afternoon and evening departures by up to 40%. Confirming passenger compensation policies before departure is key.
To optimize your domestic flight itineraries:
- Early-Morning Departures: Select flights scheduled to depart before 8:00 AM. These segments are statistically less prone to delays caused by air traffic control (ATC) restrictions or late-arriving aircraft from previous routes.
- DOT Aviation Consumer Dashboard: Review the DOT passenger dashboard online. Major airlines must provide meals, rebooking, and hotel accommodation vouchers during controllable delays (e.g., maintenance or crew issues).
- Connection Time Buffers: When connecting at congested hubs like Chicago O'Hare (ORD), Atlanta (ATL), or Dallas/Fort Worth (DFW), allow at least a 90-minute layover buffer for domestic segments and 150 minutes for international transfers.
- Alternative Carrier Comparisons: Delta Air Lines recorded the best on-time performance with a 20.42% disruption rate (19.12% delay rate), followed by United Airlines at 21.82%. Compare historical route performance when choosing between similar flight schedules.
Disruption Types and Regional Tourism Impacts
Flight delays and cancellations affect tourism economies by disrupting hotel arrivals, cruise departures, and regional car rentals. In the period reviewed, regional operators like PSA Airlines (operating regional routes for American Eagle) and Republic Airways recorded the highest cancellation rates, at 4.34% and 4.15% respectively, due to pilot availability and regional scheduling limitations.
In contrast, Frontier Airlines recorded a lower cancellation rate of 1.93%, but its high delay rate of 27.53% resulted in a combined disruption rate of 28.88%. Understanding the difference between delays and cancellations helps passengers plan connections and select travel insurance coverage for high-value trips.
Related Travel Guides
Air Canada Suspends Dubai and Tel Aviv Flights Until January 2027
Turkish Airlines Reports Record Passenger Load Factor in Q2 2026
10 Best Travel Tips for US Domestic Flights, According to Reddit
Disclaimer
This article is for informational and educational purposes only. It does not constitute legal, financial, or professional advice. While we strive to provide accurate and up-to-date information, travel policies, regulations, and conditions change rapidly. Always verify information with official sources before making travel decisions. Nomad Lawyer makes no representations about the accuracy, reliability, completeness, or suitability of the information provided. Readers should consult qualified professionals for advice specific to their circumstances. The views expressed in this article are those of the author and do not necessarily reflect the views of Nomad Lawyer.