
Tampa Records 70% Surge in South American Tourist Arrivals as Florida Gateways Expand in 2026
Tampa has outperformed Miami and Orlando in growth rates for South American arrivals, recording a 70% increase from January to May 2026, signaling a shift in Florida's international transit patterns.

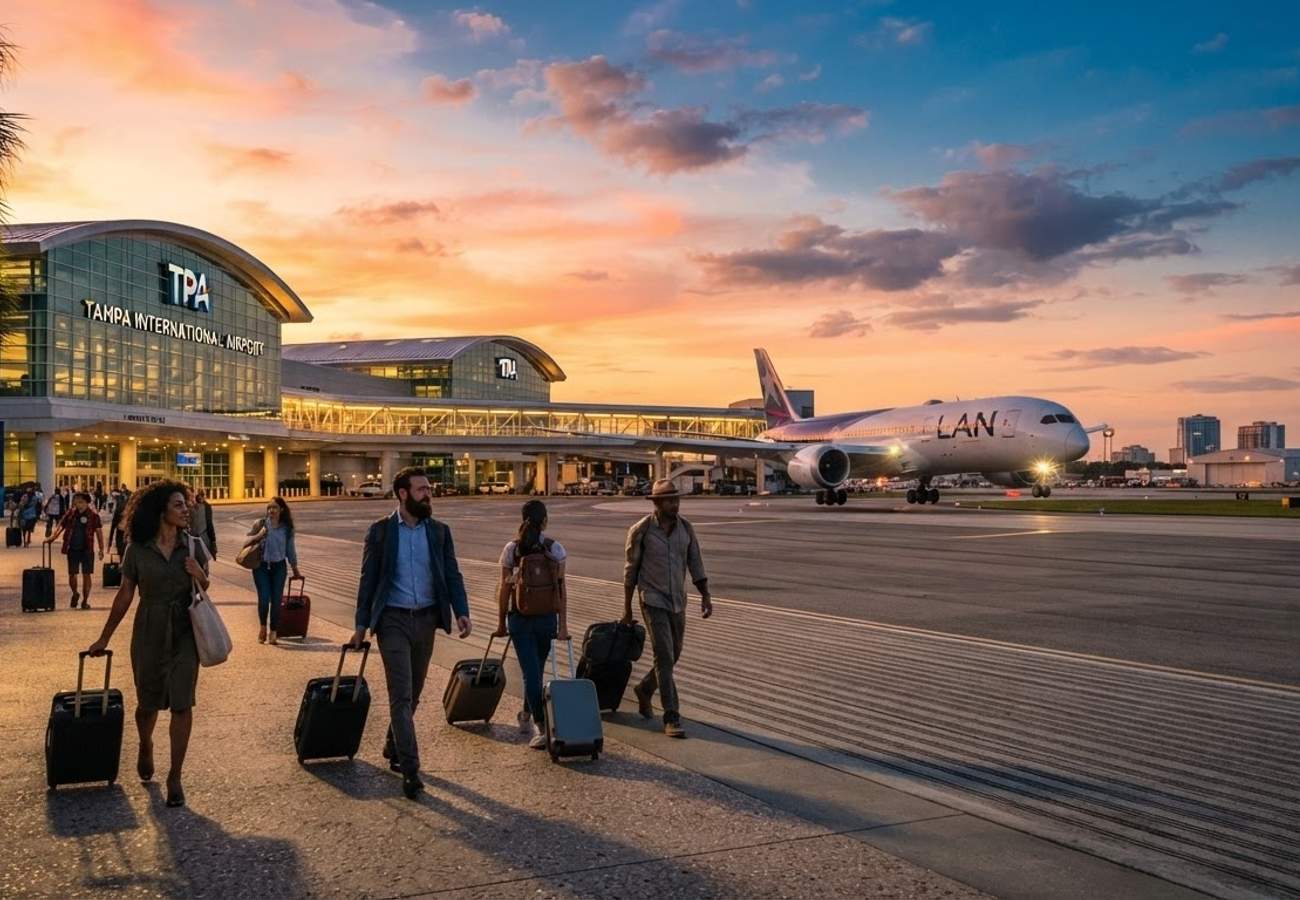
Image generated by AI
Tampa has recorded a staggering 70% increase in South American tourist arrivals between January and May 2026, outstripping the growth rates of Miami and Orlando. While Miami remains the volume leader, Tampa's rapid expansion highlights a diversification of international entry points into the United States.
South American Market Dynamics and US Entry Trends
South American travel is currently serving as a primary growth engine for the US tourism sector. Between January and May 2026, the United States welcomed 2,226,307 visitors from South America, a 5.8% increase from the 2,103,457 recorded during the same period in 2025. This growth is particularly significant given that overall US overseas visitation declined by 4.8% during this window.
Brazil continues to be the dominant source market, contributing 813,510 visitors (up 3.1%). However, the most aggressive growth is appearing in the Andean region, with Ecuador seeing a 20.8% jump to 200,471 visitors and Colombia surging 16.0% to 417,220.
South American Source Market Performance (Jan–May 2026)
| Top Source Market | Jan–May 2026 Visitors | Jan–May 2025 | YoY Change |
|---|---|---|---|
| Brazil | 813,510 | 788,692 | +3.1% |
| Colombia | 417,220 | 359,575 | +16.0% |
| Argentina | 358,312 | 338,748 | +5.8% |
| Ecuador | 200,471 | 165,946 | +20.8% |
| Top Four Combined | 1,789,513 | 1,652,961 | +8.3% |
| South America Total | 2,226,307 | 2,103,457 | +5.8% |
Florida Gateway Analysis: The Rise of Tampa
While Miami International Airport remains the largest hub by sheer volume, the growth trajectory is shifting toward secondary gateways. Tampa's 70% growth is attributed to a smaller initial base and the strategic expansion of nonstop connectivity, specifically the service to Bogotá.
Orlando continues to leverage its theme park ecosystem to attract family travelers, recording an 18.0% increase. Meanwhile, Port Canaveral is capitalizing on the cruise boom, having handled over 8.6 million passenger movements in fiscal 2025, with expectations to reach 9 million in fiscal 2026.
Comparative Growth Across Florida Transit Hubs
| Florida Gateway | Jan–May 2025 | Jan–May 2026 | Visitor Increase | Jan–May YoY | June Projection | July Projection | Aug Projection |
|---|---|---|---|---|---|---|---|
| Miami | 852,293 | 893,767 | +41,474 | +4.9% | ~+5.5% | ~+6.0% | ~+6.5% |
| Orlando | 284,544 | 335,767 | +51,223 | +18.0% | ~+16.0% | ~+14.0% | ~+13.0% |
| Port Canaveral | 21,330 | 23,975 | +2,645 | +12.4% | ~+11.0% | ~+10.0% | ~+9.0% |
| Tampa | 12,625 | 21,463 | +8,838 | +70.0% | ~+55.0% | ~+45.0% | ~+35.0% |
| Combined | 1,170,792 | 1,275,972 | +105,180 | +9.0% | ~+10-12% | ~+10-11% | ~+9-11% |
Traveler Logistics Guide: Navigating Florida's Gateways
From a ground-level perspective, the best way to navigate this shift in transit is to evaluate your final destination against the specific strengths of each gateway.
1. Choosing Your Entry Point
- For Theme Parks: While Orlando (MCO) is the obvious choice, the 18% growth indicates increased congestion. Consider flying into Tampa (TPA) and utilizing ground transfers to Orlando to avoid peak MCO crowds, especially given Tampa's expanding Latin American network.
- For Cruise Departures: If departing from Port Canaveral, coordinate your arrival with the projected 9 million passenger volume for 2026. Book airport-to-port transfers at least 48 hours in advance.
2. Digital Transit and Customs Travelers from South America should ensure all digital visas and health declarations are updated via official US Customs and Border Protection (CBP) channels. For those utilizing Miami, the high volume of arrivals (nearly 900,000 in five months) means that utilizing Global Entry or Mobile Passport Control is highly recommended to reduce wait times.
3. Connection Timing With Miami's South American seat capacity increasing by 10% for the summer (with Argentina at +53% and Ecuador at +50%), layovers at MIA are becoming more crowded. We recommend a minimum connection time of 3 hours for international-to-domestic transfers.
Infrastructure Impact Assessment
The surge in South American arrivals is forcing a redistribution of tourism infrastructure across the state. Tampa International Airport's projection of 6.1 million total passengers for the summer period indicates that the city is no longer just a regional hub but a legitimate international entry point.
The growth in Port Canaveral confirms a shift toward "cruise-centric" tourism, where the port acts as the primary anchor for spending in hotels and restaurants. This trend suggests that regional connectivity between the airports (TPA, MCO, MIA) and the ports will require further investment in high-capacity transit links to maintain efficiency as volumes scale.
Florida's transit map is being redrawn as South American demand decentralizes away from Miami.
Related Travel Guides
Disclaimer
This article is for informational and educational purposes only. It does not constitute legal, financial, or professional advice. While we strive to provide accurate and up-to-date information, travel policies, regulations, and conditions change rapidly. Always verify information with official sources before making travel decisions. Nomad Lawyer makes no representations about the accuracy, reliability, completeness, or suitability of the information provided. Readers should consult qualified professionals for advice specific to their circumstances. The views expressed in this article are those of the author and do not necessarily reflect the views of Nomad Lawyer.
Preeti Gunjan
Contributor & Community Manager
A passionate traveller and community builder. Preeti helps grow the Nomad Lawyer community, fostering engagement and bringing the reader experience to life.
Learn more about our team →