
Greece Record Tourism Surge: 43 Million Visitors and €21.7B Revenue Reshape European Travel Infrastructure

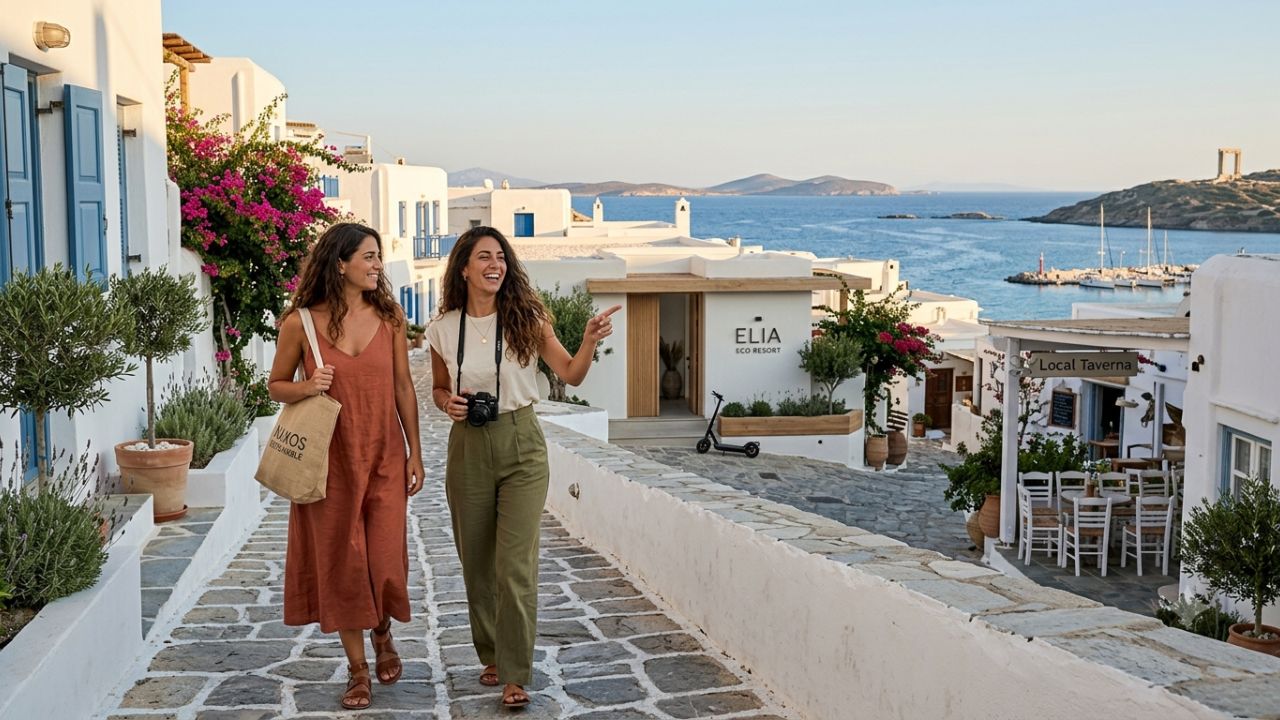
Greece has solidified its status as Southern Europe’s primary tourism engine, welcoming over 43 million international visitors against a resident population of just 10 million. Supported by €21.7 billion in annual baseline tourism receipts, a 14.8% year-on-year revenue surge in early 2026, and over €12 billion in upscale hotel investments, the nation is executing a structural transition toward high-yield, year-round travel across Athens, the Southern Aegean, and regional island destinations.
[ATHENS, Greece] — Official macroeconomic figures released by Greek tourism and financial authorities confirm an unprecedented multi-year expansion across the nation's travel and hospitality sectors. Following a landmark period where foreign arrival volumes surpassed 43 million visitors and generated over €21.7 billion in baseline annual travel revenues, Greece's tourism economy accelerated further in 2025 with a 9.4% increase in total revenue and a 6.4% growth in foreign incoming guest counts.
This upward momentum intensified during the first half of 2026, recording a 14.8% year-on-year expansion in total tourism receipts. Driven by institutional real estate investments, aviation infrastructure upgrades, expanding Balkan overland entry corridors, and stricter maritime passenger limits on islands like Santorini and Mykonos, Greece is fundamentally altering how global travelers plan Mediterranean vacations.
| Macroeconomic Metric | Value / Financial Benchmark |
|---|---|
| Annual Foreign Visitor Arrivals | Over 43 Million International Visitors |
| National Resident Population | ~10 Million Citizens |
| Baseline Annual Tourism Revenues | €21.7 Billion (2024 Baseline) |
| 2025 Revenue Expansion Rate | +9.4% Year-on-Year |
| 2025 Inbound Guest Count Growth | +6.4% Year-on-Year |
| H1 2026 Tourism Revenue Growth | +14.8% Year-on-Year |
| Total Capital Invested (2022–2026) | >€12 Billion in Resort & Hotel Development |
| Pipeline Upscale Hotels (by 2027) | >60 Upscale Resorts & Boutique Properties |
| Average Daily Rate (Athens ADR) | €177 per night (Top 5 Metropolitan Europe) |
| Target 2030 Tourism Receipts | €27.0 Billion Target (50 Million Visitors) |
Capital Deployment: €12 Billion Investment Wave and Luxury Hotel Boom
Between 2022 and 2026, institutional real estate developers and international hospitality groups deployed more than €12 billion into Greece's tourism infrastructure. This capital surge is funding more than 60 upscale resorts and boutique properties scheduled to enter service by 2027. Major asset sales highlight strong valuation metrics, with four flagship hotel transactions averaging €109.5 million per property.
Concurrently, metropolitan lodging yields in Athens experienced rapid growth. Average Daily Rates (ADR) in the capital rose to €177 per night, establishing Athens as one of Europe's top five most competitive urban hotel markets. High room yields have attracted major international hospitality brands, shifting the national product toward luxury, eco-conscious resort offerings.
| Real Estate & Yield Parameter | Value / Investment Metric |
|---|---|
| Capital Deployed into Hospitality | >€12 Billion (2022 – 2026 Period) |
| New Upscale Resorts Opening | >60 Properties Scheduled by 2027 |
| Major Hotel Acquisition Average | €109.5 Million per Location (4 Major Deals) |
| Athens Average Daily Rate (ADR) | €177 per night (Top 5 European City Markets) |
| Real Estate & Lodging Metric | Recorded Value | Market Transformation |
|---|---|---|
| Total Hotel Capital Inflow | >€12 Billion | Funds 60+ premium resort developments through 2027 |
| Athens Average Daily Rate | €177 / night | Positions Athens among Europe's top 5 luxury city markets |
| Major Hotel Asset Sales | €109.5 Million avg. | Reflects high institutional investor confidence |
| Property Management Tech | Nationwide adoption | Integrates energy-efficient automation & digital check-in |
Shifting Traveler Dynamics: High-Yield, Short-Duration Itineraries
Global visitor behavior across Greece is undergoing a structural shift toward shorter, higher-spending trips. The average length of stay per guest contracted by 35%, dropping from 7.4 nights down to 4.7 nights. However, daily expenditure per overnight stay surged 7.7% year-on-year to reach €96.60.
Despite shorter trip durations, total expenditure per trip increased to €602.20. Travel managers and tour operators are responding by offering premium, condensed itineraries centered around private cultural tours, luxury transfers, and curated culinary experiences.
| Spending & Duration Metric | Operational Benchmark & Recorded Change |
|---|---|
| Average Length of Stay per Guest | Contracted by 35% (7.4 Nights -> 4.7 Nights) |
| Daily Expenditure per Overnight | Increased +7.7% YoY to €96.60 per Night |
| Average Total Expenditure per Trip | Increased to €602.20 per Individual Trip |
| Visitor Spending Category | Performance Benchmark | Strategic Travel Impact |
|---|---|---|
| Average Length of Stay | 4.7 Nights (down from 7.4) | Guests favor condensed, multi-destination trips |
| Daily Overnight Spend | €96.60 per night (+7.7% YoY) | Higher yield per guest offsets shorter stay length |
| Total Expenditure / Trip | €602.20 per trip | Increased overall revenue per incoming tourist |
Origin Market Contributions: US and UK Visitors Lead Expenditure Growth
Inbound travel spending shows accelerated growth from non-EU origin markets. Receipts from non-EU visitors expanded by 12.2% to reach €9.11 billion, outpacing the 5.8% growth rate recorded for EU visitors, which totaled €12.12 billion.
Visitors from the United States generated the highest individual yield, spending an average of €958.66 per trip—59% above the overall international visitor baseline. Meanwhile, the United Kingdom maintained its position as the largest single European origin market, generating €3.55 billion in total receipts.
| Source Market | Total Revenue Contribution | Yield Benchmark |
|---|---|---|
| European Union (EU) | €12.12 Billion (+5.8% YoY) | Baseline regional spend |
| Non-EU Origin Markets | €9.11 Billion (+12.2% YoY) | High-growth segment |
| United States (US) | €958.66 per trip average | 59% above global avg. |
| United Kingdom (UK) | €3.55 Billion total spend | Top European contributor |
| Source Market / Region | Expenditure Volume | Key Market Characteristic |
|---|---|---|
| European Union (EU) | €12.12 Billion (+5.8% YoY) | Core regional volume across island & mainland hubs |
| Non-EU Origin Countries | €9.11 Billion (+12.2% YoY) | Rapid growth driven by transatlantic & long-haul routes |
| United States | €958.66 average per trip | Premium spender market (59% above global average) |
| United Kingdom | €3.55 Billion total receipts | Dominant European origin market for resort stays |
Aviation Infrastructure & Regional Airport Expansions
Greece’s air transport network handled 83.33 million total passenger movements across 39 commercial airports, representing a 4.9% annual increase. Direct transatlantic flights connecting North American hubs to Athens International Airport (ATH) fueled long-haul arrival growth.
Simultaneously, regional island airports recorded an 11% surge in summer international flights, helping manage peak-season passenger volumes across coastal air corridors.
| Aviation Metric | Volume Benchmark |
|---|---|
| Total Commercial Airport Traffic | 83.33 Million Movements across 39 Airports |
| Annual Traffic Growth | +4.9% Year-on-Year |
| Regional Island Flight Surge | +11% Increase in Summer International Flights |
Maritime Tourism: Cruise Passenger Caps and Passenger Levies
The maritime sector remains a major gateway for coastal tourism. Cruise line passenger volumes reached 5.61 million travelers (+12.0% YoY), while island and mainland ports logged 8.18 million total transit stopovers. Ashore excursion activities generated over 14 million total overnight stays in coastal communities (+13.2% YoY).
To manage foot traffic and protect fragile island ecosystems, Greek maritime authorities implemented strict operational rules:
- Daily Passenger Cap: Santorini and Mykonos capped cruise ship passenger disembarkations at 8,000 visitors per day.
- Peak Maritime Levy: Introduced a peak-season disembarkation fee of €20 per cruise passenger, with proceeds allocated to municipal waste treatment, water production, and local transit infrastructure.
| Maritime Metric / Regulation | Recorded Benchmark / Policy Limit |
|---|---|
| Annual Cruise Passengers | 5.61 Million Travelers (+12.0% YoY) |
| Total Port Transit Stopovers | 8.18 Million Port Visits |
| Excursion Overnight Stays Ashore | Over 14 Million Stays (+13.2% YoY) |
| Santorini & Mykonos Daily Cap | 8,000 Passengers Maximum per Day |
| Peak Season Cruise Disembarkation Fee | €20 per Passenger Surcharge |
| Maritime Parameter | Recorded Metric / Regulation | Strategic Environmental Objective |
|---|---|---|
| Cruise Passenger Volume | 5.61 Million (+12.0% YoY) | Major driver of coastal & island retail spend |
| Daily Passenger Limit | 8,000 max / day (Santorini & Mykonos) | Prevents severe pedestrian overcrowding at ports |
| Peak Maritime Fee | €20 / passenger disembarkation | Direct municipal funding for eco-system preservation |
| Excursion Overnight Stays | >14 Million stays (+13.2% YoY) | Expands shore excursion spend in coastal towns |
Geographic Dispersal: Southern Aegean and Attica Lead Regional Volume
Visitor night distribution remains concentrated across core regions:
- Southern Aegean: Recorded 53.1 million visitor nights, capturing the largest share of overall visitor spending across island hubs like Rhodes, Kos, and the Cyclades.
- Attica (Athens Metropolitan Area): Emerged as the most visited single administrative region with 48.9 million overnight stays.
- Top 5 Regions Combined: Account for 87.9% of total foreign visitor overnights, prompting ongoing government initiatives to promote secondary inland destinations.
| Administrative Region | Overnight Stays Share | Regional Significance |
|---|---|---|
| Southern Aegean Islands | 53.1 Million Visitor Nights | Top destination region |
| Attica (Metropolitan Athens) | 48.9 Million Visitor Nights | Most visited single area |
| Top 5 Regions Combined | 87.9% of All Foreign Stays | Primary tourism core |
Surge in Balkan Overland Driving Routes
Overland land border entries across northern Greece experienced rapid growth. Inbound tourist arrivals through northern border checkpoints surged by 64.5%, outperforming air travel growth rates.
Road arrivals now represent 6.9% of total non-resident inbound entries, driven primarily by auto travelers from neighboring Balkan countries, including Bulgaria, Albania, and North Macedonia. This cross-border driving traffic supports northern regional economies and boosts shoulder-season tourism.
| Overland Travel Metric | Recorded Output |
|---|---|
| Northern Land Border Arrival Growth | +64.5% Year-on-Year Growth |
| Land Border Share of Inbound Entries | 6.9% of Total Foreign Arrivals |
| Key Source Countries | Bulgaria, Albania, North Macedonia |
Sustainability Mandates, Public Budgets, and Off-Peak Expansion
To align tourism growth with environmental protection, national authorities deployed a dedicated €162.6 million tourism budget for green infrastructure, waste management, and sustainable resort upgrades, alongside €15.8 million for promotional campaigns highlighting shoulder-season travel.
The long-term national policy targets €27 billion in annual travel receipts and 50 million visitors by 2030. Campaigns promoting off-peak travel during autumn, winter, and spring delivered early results, driving a 64.3% year-on-year revenue increase in the first quarter (Q1).
| Policy / Employment Metric | Value / Target Benchmark |
|---|---|
| National Green Tourism Budget | €162.6 Million Deployed |
| Off-Peak Campaign Promotion Budget | €15.8 Million Deployed |
| Off-Peak Q1 Revenue Expansion | +64.3% YoY Revenue Surge in Q1 |
| Direct Hospitality Jobs Sustained | 451,000 Official Jobs (Base Employment) |
| Peak Summer Hospitality Staffing | 713,000 Workers (16.5% of National Labor Force) |
The hospitality sector directly supports 451,000 year-round jobs, rising to 713,000 workers during peak summer months—representing 16.5% of total national employment (roughly 1 in every 6 working citizens).
Why This Matters (Information Gain & Experience)
Greece’s tourism strategy illustrates how a major Mediterranean destination can balance record arrival numbers with long-term economic returns and environmental sustainability. For international travelers, shorter trip durations and higher daily expenditures mean that vacationing in Greece requires earlier bookings, particularly for luxury island resorts and popular urban hotels in Athens.
For global travel managers and destination developers, Greece demonstrates that combining institutional real estate investment (€12B+), strict cruise caps (8,000/day), and targeted shoulder-season campaigns (+64.3% Q1 revenue) can generate sustainable, year-round tourism growth while preserving local cultural assets.
Frequently Asked Questions
How many international tourists visited Greece in 2025?
Greece welcomed over 43 million international visitors in 2025, supported by €21.7 billion in baseline tourism receipts.
What are the new cruise passenger restrictions in Santorini and Mykonos?
Greek maritime authorities capped daily cruise ship passenger disembarkations at 8,000 visitors per day for both Santorini and Mykonos, alongside a peak-season maritime levy of €20 per passenger.
How much do international visitors spend on average in Greece?
The average expenditure per trip reached €602.20, with daily overnight spend rising to €96.60 per night. Visitors from the United States recorded the highest average spend at €958.66 per trip.
How is Greece extending its tourism calendar into off-peak months?
Through targeted promotional campaigns backed by €15.8 million in funding, Greece expanded off-peak travel during autumn, winter, and spring, delivering a 64.3% year-on-year revenue surge in Q1.
How many jobs are supported by tourism in Greece?
The hospitality and food service sectors sustain 451,000 year-round jobs, expanding to 713,000 workers during peak summer months—representing 16.5% of total national employment (roughly 1 in 6 workers).
Related Travel Guides
Disclaimer
This article is for informational and educational purposes only. It does not constitute legal, financial, or professional advice. While we strive to provide accurate and up-to-date information, travel policies, regulations, and conditions change rapidly. Always verify information with official sources before making travel decisions. Nomad Lawyer makes no representations about the accuracy, reliability, completeness, or suitability of the information provided. Readers should consult qualified professionals for advice specific to their circumstances. The views expressed in this article are those of the author and do not necessarily reflect the views of Nomad Lawyer.
Kunal K Choudhary
Co-Founder & Contributor
A passionate traveller and tech enthusiast. Kunal contributes to the vision and growth of Nomad Lawyer, bringing fresh perspectives and driving the community forward.
Learn more about our team →