
Alaska Joins West Virginia, New Mexico and More US States with the Highest Fatal Accident Rates
Alaska Joins West Virginia, New Mexico and More US States with the Highest Fatal Accident Rates

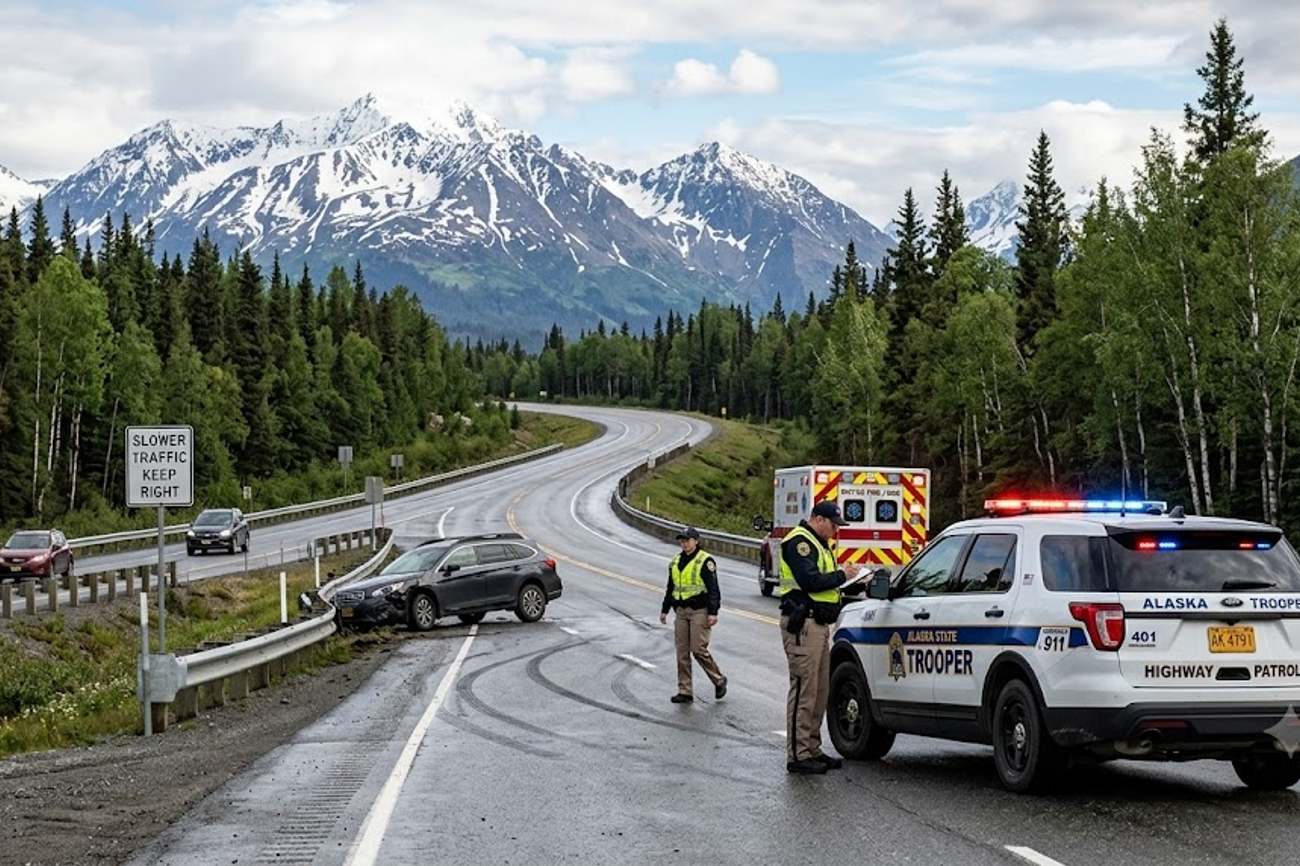
Image generated by AI
An age-adjusted accidental death rate of 91.4 per 100,000 residents places Alaska at the pinnacle of fatal accident risks in the United States. This figure, emerging from a September 2026 analysis by Whitley Law Firm, signals a profound disparity in how geography, public health crises, and infrastructure intersect to create lethal environments for residents and visitors alike. While often perceived as a wilderness paradise, the data reveals that Alaska is the most dangerous state for unintentional fatalities, outstripping other high-risk regions through a combination of systemic medical isolation and a devastating overdose epidemic.
The Geography of Lethality: Alaska and the Remote Care Gap
The primary driver behind Alaska's ranking is not a single failure of policy, but a compounding effect of logistical isolation. In most U.S. states, the "golden hour"—the critical window following a traumatic injury where medical intervention is most likely to prevent death—is a standard benchmark for emergency services. In Alaska, this window is frequently shattered by the sheer distance between remote settlements and specialized trauma centers.
According to the report, the state's risk profile is heavily weighted by drug overdose deaths and the inherent challenges of its terrain. The logistical chain for emergency response in the Far North relies on a fragile mix of aviation, marine transport, and road networks that are frequently compromised by severe weather. When a medical emergency occurs in a village far from an urban hub, the transport time to a facility capable of providing definitive care can be the difference between survival and a recorded fatality. This systemic vulnerability transforms manageable accidents into fatal events, contributing to the state's top position in the age-adjusted rankings.
Comparative Risk Metrics: Overdoses, Roads, and Malpractice
The September 2026 study utilizes a composite methodology, blending three distinct data streams: motor vehicle fatalities, drug overdose deaths, and medical malpractice claims. This approach reveals that "danger" is not monolithic; a state may be lethal on the highway but stable in its clinics, or vice versa.
The following data breakdown illustrates the divergent risk factors across the most affected states:
| State | Age-Adjusted Accidental Death Rate (per 100k) | Drug Overdose Deaths (per 100k) | Motor Vehicle Deaths (per 100k) | Medical Malpractice Claims (per 100k) |
|---|---|---|---|---|
| Alaska | 91.4 | 45.1 | 9.5 | 1.62 |
| West Virginia | 87.6 | 48.9 | 14.5 | 3.67 |
| New Mexico | 79.3 | 37.1 | 19.2 | 8.40 |
| Tennessee | 75.0 | 35.2 | 16.6 | Not Listed |
| Oklahoma | 74.0 | 25.5 | 15.7 | 2.78 |
| Mississippi | Not Listed | 18.6 | 25.6 | Not Listed |
The data exposes a critical nuance: while Alaska has the highest overall accidental death rate, it is not the most dangerous state for drivers. That distinction belongs to Mississippi, which records 25.6 motor vehicle deaths per 100,000 residents. Conversely, West Virginia represents the epicenter of the overdose crisis among the studied group, with 48.9 deaths per 100,000 people.
Medical malpractice provides a different lens into systemic failure. New Mexico leads the group in claim frequency with 8.40 claims per 100,000 residents. Alaska, however, presents a financial anomaly; while its claim rate is a relatively low 1.62 per 100,000, the average payout per claim is the highest in the study, reaching approximately $1.015 million. This suggests that while errors may be less frequent in Alaska, the outcomes of those errors are often catastrophic.
Expert Analysis: The Infrastructure of Risk
For the modern traveler or digital nomad relocating to these regions, these statistics translate into specific, actionable risks. The data suggests that the "danger" of a location is often a byproduct of its infrastructure—or lack thereof.
The pricing pressure on healthcare in Alaska is reflected in the $1.015 million average malpractice payout. This high figure likely stems from the severity of injuries that occur when care is delayed. For a traveler booking a trip to the Alaskan interior, the direct consequence is that a minor accident in a remote area is statistically more likely to become fatal than the same accident in a state like New Mexico, despite New Mexico having higher malpractice claim rates.
Furthermore, the disparity between Mississippi's road fatality rate (25.6) and Alaska's (9.5) highlights a difference in the nature of the risk. Mississippi's danger is likely rooted in road design, traffic density, and driving behavior. Alaska's danger is rooted in the "post-accident" phase—the struggle to reach a hospital.
The prevalence of overdose deaths in West Virginia (48.9) and Alaska (45.1) indicates a systemic public health collapse that intersects with the Centers for Disease Control and Prevention (CDC) guidelines on opioid crisis management. When these health crises occur in geographically isolated areas, the mortality rate spikes because there are fewer first responders equipped with overdose-reversal agents like naloxone.
Ultimately, these figures prove that accidental death is not a random occurrence but a predictable outcome of specific regulatory and logistical failures. The correlation between high overdose rates and high overall accidental death rates suggests that the opioid epidemic is now a primary driver of U.S. mortality, outweighing traditional "accidents" like car crashes in several states.
Key Takeaways
- Composite Risk: Alaska holds the highest age-adjusted accidental death rate in the U.S. at 91.4 per 100,000, driven by a combination of overdose deaths and medical isolation.
- Road Danger: Mississippi is the most lethal state for drivers, with 25.6 motor vehicle deaths per 100,000 residents, significantly higher than Alaska's 9.5.
- The Overdose Crisis: West Virginia suffers the highest overdose mortality rate among the studied states at 48.9 per 100,000.
- Medical Disparity: New Mexico has the highest frequency of medical malpractice claims (8.40 per 100,000), but Alaska has the highest average financial payout per claim at $1.015 million.
- Logistical Impact: Remote geography in Alaska creates a "trauma gap," where the distance to emergency care increases the probability that an accident becomes fatal.
FAQ: US Fatal Accident Risks 2026
Which US state is the most dangerous for drivers? Based on the September 2026 data, Mississippi is the most dangerous for motor vehicle fatalities, recording 25.6 deaths per 100,000 residents. New Mexico follows with 19.2 deaths per 100,000.
Why does Alaska have the highest overall accidental death rate? Alaska's rate of 91.4 per 100,000 is caused by high drug overdose rates (45.1 per 100,000) and extreme geographical isolation, which delays access to critical emergency medical trauma care.
How does West Virginia compare to Alaska in accidental deaths? West Virginia ranks second overall with a rate of 87.6 per 100,000. While Alaska is higher overall, West Virginia has a higher drug overdose death rate (48.9) and a higher motor vehicle death rate (14.5).
What is the link between medical malpractice and accidental death in these states? Malpractice claims indicate systemic medical errors. While New Mexico has the most claims (8.40 per 100,000), Alaska has the most expensive claims, averaging $1.015 million, reflecting the severity of medical failures in remote areas.
The map of American risk is no longer just about dangerous roads, but about the distance between a crisis and a cure.
#Alaska #WestVirginia #NewMexico #PublicHealth2026 #WhitleyLawStudy #USRoadSafety
Related Travel Guides
Disclaimer
This article is for informational and educational purposes only. It does not constitute legal, financial, or professional advice. While we strive to provide accurate and up-to-date information, travel policies, regulations, and conditions change rapidly. Always verify information with official sources before making travel decisions. Nomad Lawyer makes no representations about the accuracy, reliability, completeness, or suitability of the information provided. Readers should consult qualified professionals for advice specific to their circumstances. The views expressed in this article are those of the author and do not necessarily reflect the views of Nomad Lawyer.
Naina Thakur
Contributor & Travel Specialist
Travel enthusiast and legal writer covering visa regulations, responsible tourism, and cultural journeys across global destinations.
Learn more about our team →